2015 Conference on Systems Engineering Research
Shared
Awareness among Project Team Members through
Role-based Simulation during Planning – A Comparative Study
Michal Iluza[*], Bryan Moserb, Avraham Shtuba
a Faculty of Industrial Engineering and Management, Technion—Israel Institute of Technology
b Engineering System Division, Massachusetts Institute of Technology, Cambridge, MA, USA
Abstract
In this study we investigate how teams analyze tradespace early on in the life cycle of projects. Specifically we observe how levels of engagement – based on active involvement in project tradespace exploration – influences the quality of project plans and readiness of teams for performance. We hypothesize that shared awareness of project dynamics among project stakeholders increases through simulation-based training during the planning process. To test the hypothesis and the conditions of such increase, we conducted a comparative study comprising controlled experiments at Technion and MIT, using two Project Management planning approaches: (1) The traditional Gantt chart development supported by critical path analysis and (2) role-based project simulation. This study of a small test population shows a difference in the increase of shared understanding among project stakeholders based on the planning method followed. These initial results suggest that a team’s method for tradespace exploration matters, influencing shared awareness early on in the project life cycle. In future experiments we hope to further test this finding and continue to investigate correlation with readiness for improved decision making throughout the project life cycle.
© 2015 The Authors. Published by Elsevier B.V.
Peer-review under responsibility of the scientific committee of Stevens Institute of Technology.
Keywords: Project Team Awareness, Tradespace Exploration, Planning, Simulation
1. Background: Shared Understanding
People navigate their social and organizational environment by developing mental models. These models comprise mental descriptions of system purpose and form, and explanations of system functioning and system states; i.e., internally constructed descriptions or explanations of a system’s purpose, form, functioning, and states, as well as predictions of future system states (Rouse & Morris, 1986: 351). Mental models translate reality into internal representations, and these translations guide the way people cope with requirements posed by reality (Park & Gittleman, 1995: 303).
Sharing of mental models is critical to the functioning of teams. Team members have their own individual mental models that represent their understanding of the team's goals and characteristics, and the connections between their own work and collective actions (Marks, Sabella, Burke & Zaccaro, 2002). Individual mental models also include prescriptions about the roles and behavior patterns required from each member for successful completion of the collective team's tasks (Marks et al., 2002).
When the individual mental models of different team members are similar, a shared mental model or a team shared understanding can be argued to exist. A shared understanding can be defined as a "shared, organized understanding and mental representation of the key elements of the team's relevant environment" (Mohammed & Dumville, 2001: 90).When team members share a highly crystallized understanding, they work with a common understanding of each member's roles and responsibilities, and a single set of expectations about the team's needs, goals and constraints (Cannon-Bowers et al., 1993; Weick & Roberts, 1993).
Put differently, team-shared understanding comprises the agreed-upon or convergent understanding that team members hold about the team and its tasks, including their circumstances, constraints and context (Feldman & Rafaeli, 2002).
When the mental models of different team members are similar, the result is a shared mental model or team-level shared understanding , i.e. a “shared, organized understanding and mental representation of the key elements of the team’s relevant environment” (Mohammed, L. Ferzandi, and K. Hamilton, 2010). We follow Rafaeli et al. (2009) and use the term “team-shared understanding” to emphasize the importance of this construct as a team attribute.
A team-shared understanding is both a product and a source of collective explanations and expectations about the team’s goals and work processes [4,16]. That is, a shared understanding develops gradually through the exchange of information, based on which team members analyze possible consequences of their actions and modify their behaviors (Qureshi, M. Liu, and D. Vogel, 2006). Ultimately, team members should aim to develop a common conception of each other’s roles and responsibilities, and a single set of expectations about the team’s needs, goals, and constraints (Weick and K. H. Roberts, 1993). In a self-reinforcing loop, this shared understanding then facilitates communication and coordination, as team members become more adept at synchronizing their activities. Because members of such teams can better anticipate or predict the activities and needs of others, they are more adaptable to changing demands, which in turn makes team processes more effective [2,8,14,17].
Shared understanding is both derived from, and helps team members formulate collective explanations and expectations about the team's work processes, and to facilitate communication and coordination of team activities (Cannon-Bowers & Salas, 1997; Jeffery et al., 2005).
Finally, Cannon-Bowers et al. (1993) have identified the Team interaction model that outlines how team members work with each other. Other scholars have suggested somewhat different, but conceptually compatible typologies. Kraiger and Wenzel (1997) suggested that team mental models comprise three elements: knowledge, behavior, and attitudes. By knowledge they refer to organized and structured assumptions about the task, process, or reactions to the environment. By behavior they mean team members’ mutual expectations; and attitude encompasses interpretations and affective reactions of the team, its behavior in relation to its environment.
Marks et al. (2002) offered a broader conceptualization of team mental model, distinguishing between task-work and team-work. They defined "task-work" as “a team’s interactions with tasks, tools, machines, and systems” (Bowers, Braun, & Morgan, 1997: 90). Task-work represents what it is that teams are doing. In contrast, team-work describes how teams are doing whatever they are doing (Marks et al., 2002). Continuing this line of thought, Mathieu, Hefner, Goodwin, Salas and Cannon Bowers (2000) argued that in order to be successful, team members should be able to perform task-related functions while also working well together as a team i.e., they connect the performance of “task-work” to effective “team-work.” These dynamics, which operate at the team level, depend on the level of similarity between the individual models of different members.
Thus, multiple and different mental models may co-exist in the minds of team members, with individual members of a team themselves likely to hold not one, but multiple mental models (Klimoski & Mohammed, 1994). Furthermore, teams are likely to contain multiple models representing the multiple members of the team.
Likewise, in organization and industrial settings with regular dynamic change of participants, processes, and the products or services being generated, there is a larger chance that these teams’ tacit knowledge borne of past experiences with dissimilar participants, process, and products will be less relevant, if not misguiding. Therefore, the capability of teams to overcome assumptions from past work and build mental models for the situation at hand may be critical to performance.
2. The study
For this study, a project-based scenario was developed based on a real, recent systems development project (detailed scenario descriptions can be found in Appendix A). The essence of the experiment is to let the participants explore various project scope (technological and operational alternatives) and resource combinations as to “plan” the project themselves. Their goal is to optimize the ratio between system performance and costs (cost benefit analysis).
Our experiment was designed as follows. A crossover experiment was prepared to test whether simulation-based role-playing during the planning process impacts shared understanding amongst team members and whether it improves tradeoff analysis and decision making. This crossover experiment had the teams began with one of two planning methods – either classic Gantt and critical path methods or a simulation-based method – and then to switch to the other method in the latter half of the experiment. The teams used Microsoft Project (MSP) as a toolset for the classic project planning mode, and Project Team Builder (PTB) as a toolset for the simulation mode.
Participants were randomly divided into teams and roles, each including a Project Manager, a Systems Engineer, and a Quality Assurance Engineer. The teams’ target was to optimize the ratio between system performance and costs.
2.1. The project scenario
In this section the real life project that was used in our experiments is described.
2.1.1. Scenario background
The scenario used is based on a real project. An air force decided to refurbish the communication systems in airborne platforms and in ground stations. The new communication systems should have all the capabilities of the old ones as well as to add new capabilities. The required production is thousands of systems within the next few years. The project is complex, high technology project, similar systems were developed worldwide but not by the Israeli Defense Company. Its development requires uniquely skilled human resources. The project is managed in a multi project environment. The project is performed in a matrix-like organization structure (human resources are not managed directly by the project manager)
2.1.2. Project Scope (“The System”)
· A transceiver conveying a sound signal (speech) over a wireless communication channel.
· The main box includes digital and analog hardware for the implementation of main system requirements. (Box mechanics, controller board, modem board, software, and firmware).
· Power amplifier –amplifying transmission signals.
· Power supply –supplying power to the amplifier and the main box.
· Antenna – supplied as GFE as part of the platform. The design should comply with its radiation curve.
The system block diagram is presented in figure 1.
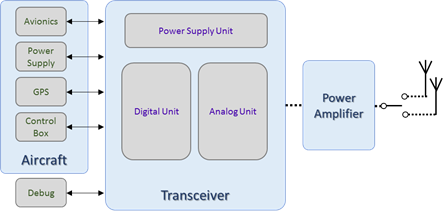
Figure 1: System block diagram
The simulated scenario reflects two typical design alternatives, (1) Improvement of receiver reception sensitivity. And (2) transmission power increase. In simpler terms, these alternatives can be explained by: “listening more carefully or shouting louder”. These engineering tradeoffs are typical considerations of communication engineers. A full description of the experiment protocol and scenario description is available from the corresponding authors.
2.2. Analysis of the tradespace
The tradespace consists of all possible values of the cost/benefit pair. The tradespace can be plotted on a cost/benefit graph, where the set of maximal benefits for each cost is termed the "efficiency frontier". Fig. 2 shows the efficiency frontier for our case study, derived by using the simulator to automatically run the scenario with randomly generated execution durations for each possible design alternative and then selecting the highest benefit for each resulting cost. The starting cost/benefit point for the experiments is indicated. Also in the experiment the charter of each planning team included a budget limit, which would become apparent in the simulations as negative cash flow midway through the project. That budget limit is indicated on the right of Figure 2.
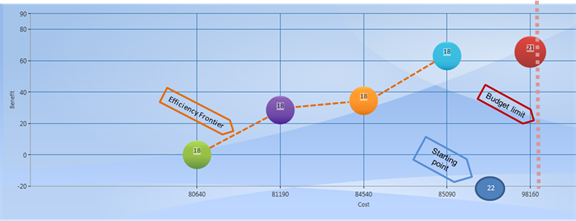
Figure 2: The efficiency frontier (designated by the dotted line) for the transceiver project. Experiment starting point and budget limit are indicated. The value in the circles represents the project duration in months.
2.3. Part I of the experiment – Using Gantt Charts and QFD
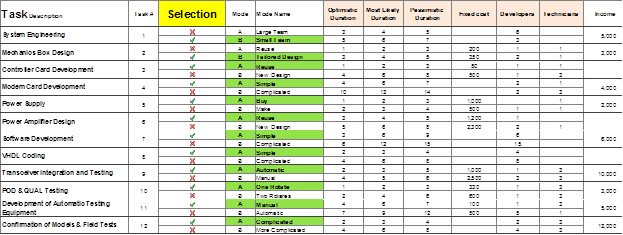
The participants attended a short lecture on their selected project subject so that they understand the project framework, goals, stakeholders, etc. After the lecture, the participants were given an Excel file (see Appendix A) which included the project data: list of activities, alternatives per each activity, resources, duration range, etc. In addition, the default plan is designated in the file. The file also enables the participants to calculate the project benefit score, defined as the weighted sum of the scores attributed to the compliance with each project technical requirement (also known as the Quality Functional Deployment or QFD matrix, see Fig 3.)
The team members were then given a ready-made default plan consistent with the above mentioned project data. This default plan does not meet all project goals. The team's objective was to jointly modify the plan in order to meet the project goals using tradeoff analysis. (The plan was represented in MSP, a commercial project planning software).
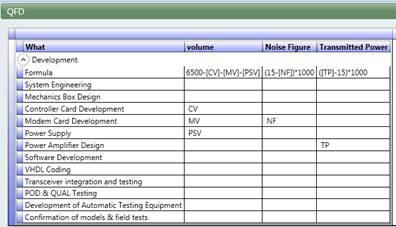
Figure 3: The QFD matrix for the transceiver project.
The experiment measures the shared understanding amongst the team members. This process, which evolves over time, is measured during the experiment by asking the participants to answer a set of questions every 15 minutes in order to track the development of the team members' shared understanding. An example of a typical question is: "Rate your understanding of the project goals on a scale of 1 to 5".
In addition, during the experiment each team records the scenarios considered through changes to their Gantt Chart based project plan. These scenarios, along with the timing and outcomes on benefit, cost, and schedule, were recorded.
Upon completion of exploration of multiple scenarios within a limited time period, the participants select a recommended scenario and fill out the plan results: duration, cost – displayed by MSP as well as the benefit score as calculated by a spreadsheet.
Significantly, the Microsoft Project software acted as a single step black box; changes to scope (as tasks) and resource size provide a single and immediate answer. The participants did not role play or step through the project to experience the unfolding of project outcomes over time.
2.4. Part II of the experiment – Using Role-based Project Simulation
In this part of the experiment, the participants receive the same starting scenario in a software tool that allows stepping through the simulation in time steps, reviewing the intermediate progress and issues in the project, and adjusting project characteristics prior to the next step. (This experience utilized Project Team Builder (PTB), a commercial project simulation based training tool.).
Similar to the first part of the experiment, the team is requested to jointly modify the plan in order to meet the project goals using tradeoff analysis. The resulting plan is subsequently run on the simulator. The team's shared understanding is measured similarly to Part I. Upon completion of the simulation – the simulation results are recorded.
A typical timeframe of this experiment is approximately four hours.
2.5. Experiment Environment
We performed the experiment in two different environments. At the Technion, the experiment was held in a computer laboratory; the teams were seated in groups of three team members around each computer. In this case there were no remote participants.
In the MIT experiment each team had a separate well equipped breakout room in which to work. Each room included a large screen, a phone, a desk and chairs. Some of the MIT teams were entirely remote whereas others consisted of both "on campus" participants along with remote participants.
Another difference between the two sites was the presence at MIT of a command and control room in which teacher assistants alongside experiment managers. All teams were in contact via WebEx (a video, audio, and screen sharing online communication). Any real time message was either given by phone or via WebEx so that all participants could notice it as an online message, appearing on their screens. Using this method enabled the experiment managers to control the point in time in which the computerized questionnaires were distributed and subsequently filled out. In addition, any team experiencing trouble could write to the command and control room and get an immediate response. Following are a few photos taken at the MIT experiment and convey the experiment environment. In general, this type of experiment can easily be adapted to a large variety of working environments.


Figure 4: The teams were given common starting conditions before an intense few hours of planning some teams began with role-based simulation, while others began with traditional methods.
3. Results and Analysis
The total sample size was 95 participants. The data is analyzed in the following three dimensions:
1. Simulation Based Training (SBT): did the team use SBT to generate the scenario
2. shared understanding: a self-reported measure of the evolvement of the team's members of the project goals and objectives during the experiment.
3. project outcomes: for each scenario, the plan’s forecast cost, duration, and benefit.
A run of the experiment was performed with 31 teams:
· 19 ME Technion teams (11 teams started with the MSP and then used PTB, 8 teams started with the PTB and then used MSP). Each team included 3 team members. The sample size (i.e., the total number of participants) was N=57.
· 12 MIT ESD student teams (6 teams started with the MSP and then used PTB, 6 teams started with the PTB and then used MSP). Each team included 2-4 team members. The sample size was N=38.
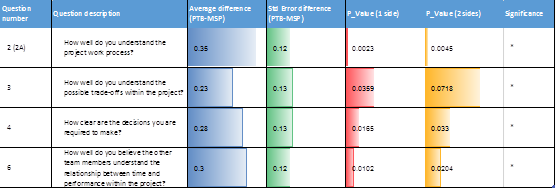
The influence of the method used on shared understanding and on the tradeoff analysis was determined by statistical analysis of the questionnaire answers. A Signed-Rank test was performed on two independent samples (11/8, 6/6). This test resembles a single t-test. The differences (PTB-MSP) between the answer given following use of the simulation-based approach (PTB) and the answer given following use of a traditional Gantt and CPM approach (MSP) were analyzed. In the cases where the mean value is positive (negative) and the P value < 0.05 (indicating significant statistic), the result suggests a favorable scoring of PTB (MSP). In other cases, the average result was negative, but the P value was not significant (>0.05). In these cases no conclusion could be drawn in favor of any of the tools. An example of the analysis results is depicted in the following table:
3.1. The Technion sample results:
Table 1: Technion sample Difference analysis results summary on the question level.
3.2. The MIT sample results:
Table 2: MIT sample Difference analysis results summary on the question level.
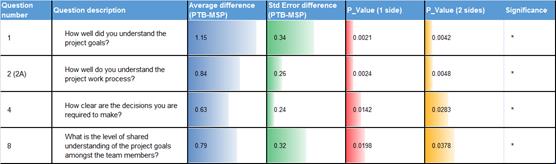
In the Technion experiment 10 out of 16 questions (over 60%) show statistical significance; in all these cases the role-based simulation was in advantage over traditional Gantt based planning. The results indicate: (1) a high level of shared understanding of the project goals and as well as project work processes; (2) a greater extent of the understanding of the possible tradeoffs that can be made in the project; (3) clarity of decision made during the simulation; (4) effectiveness of the teamwork and (5) high satisfaction with the overall project outcomes.
It is worth mentioning that no significant different was seen with regard to which of the two methods was used first by the team.
In the MIT experiment 7 out of 16 questions exhibit a statistical significance. The analysis was performed separately for the teams that started with PTB tool and for the teams that started with the MSP tool. The PTB-first teams showed statistical significance in 2 out of 16 questions, in particular the shared understanding questions: How well did you understand the project goals? The MSP-first teams showed statistical significance in 5 out of 16 questions, all of which concern shared understanding and team work. All the above monition significance results indicate the preference of a simulation based approach.
4. Experiment Limitations
We describe several limitations of our experiment as delivered. Addressing some of these limitations can constitute the basis of future research:
· Experiment duration: The time frame allotted to the experiment was limited, a result of which limitation was that some of the teams did not complete the entire simulation.
· Measure of Shared Understanding: In the present research shared understanding was measured by the questioners comprising primarily of qualitative questions given a subjective rating on scale of 1-5. As defined and sampled, the measure is specifically a measure of the confidence of an individual in their own understanding of the project and it’s tradespace. Future research should attempted to develop additional means of measuring shared. These measures should include unobtrusive observational measures, such as activity transactions, project plan as artifact evolution, in line measures of process, interaction and so on. The correlation between individual perception of understanding and shared mental models should be examined.
· Technical issues: Some participants were not familiar sufficiently with the methods used throughout the experiment which caused some technical difficulties caused and unnecessary holdups. For our earlier trials, we also needed to restart the setup a few times. A pre-training session could help alleviate these technical issues.
· Representative Methods, Yet Specific Software: The experiment is designed to be deployed using specific software tools, none of which perfectly embody the differences between traditional project planning and role-based and engaging simulation based methods. Any software tool does some things very well, others poorly, and in many cases specific functionality which promotes or dissuades engagement may not exist in any given software. We chose MSP and PTB as representative tools for the methods, yet will need to conduct experiments across various tools.
5. Further Work and Collaboration
The issue of distributed work teams collaborating on a shared mission arises much interest due to contemporary prevalence of global work teams. Our experiment comprised both local teams as well as distributed teams. Thus, the current experimental set up could be used to compare various aspects of the performance of local teams and global teams.
Our experience has shown that the time span should be extended to more than four hours to enable each team to attempt multiple scenario strategies and to come up with a result. This experiment may be run a number of times for pre-project simulation or for analysis and risk reduction before a project begins by front end loading.
Full observations of the working teams may be analyzed to assess the level of shared awareness that the team achieved. Personal interviews of team members may also prove to be useful.
Our observations – both quantitatively and qualitatively – of the experience and results of teams suggest that this experiment platform may be used to explore drivers of planning quality and team share understanding. In particular, the path of exploration (across multiple project scenarios) showed a strong variation in tradespace coverage and pace as they made changes to their project plan. Some teams rapidly explored various combinations across the triple constraint of cost, schedule, and benefit. Other teams focused on only cost or schedule in a given period. Further, some teams focused in a smaller region within the tradespace (perhaps a local minima) and were unable to approach the experiments Pareto frontier.
In future experiments we will look for correlation between these paths of exploration and the plan and teaming outcomes.
6. Conclusion
This initial study for a small experiment size shows some statistically significance in the increase of shared understanding among project stakeholders based on the planning method followed. The study was conducted in two universities in different countries. The results indicate that role-based simulation – more typically used in training – can facilitate the creation of shared understanding among project team members during planning as compared to a Gantt/ PERT chart based non-simulation approach. Further steps in this research with improved experiment protocol, larger experiment population, and investigation of the underlying drivers of this difference are planned. In future experiments we hope to further test this finding and continue to investigate correlation with readiness for improved decision making throughout the project life cycle.
7. Appendix A - Scenario data Excel file
8. Acknowledgements
The authors would like to thank MIT teaching assistants Kathleen Voelbel and Narek Shougarian for their excellent work in the preparation and coordination of the experiment. This research was supported by the Bernard M. Gordon Center for Systems Engineering at the Technion—Israel Institute of Technology.
9. References
1. Bowers, C. A., Braun, C. C.,& Morgan, B.B. (1997). Teams workload: Its meaning and measurement. In M.T. Brannick, E. Salas, & C. Prince (EDs.), Team performance assessment and measurement: Theory, methods, and applications (pp. 85-108) Mahwah, NJ: Erlbaum
2. Cannon-Bowers, J.A., Salas, E., & Converse, S.A. (1993). Shared mental models in expert team decision making. In N.J. Castellan Jr (Ed.), Current Issues in Individual and Group Decision Making (pp. 221–246). Hillsdale, NJ: Erlbaum.
3. Feldman, M.S., & Rafaeli, A. (2002). Organizational routines as sources of connections and understandings. Journal of Management Studies, 39(3), 309–331.
4. A. B. Jeffery, J. D. Maes, and M. F. Bratton-Jeffery, “Improving team decision-making performance with collaborative modeling,” Team Performance Management, vol. 11, pp. 40–50, 2005.
5. Klimoski, R., & Mohammed, S. (1994). Team mental model—construct or metaphor.Journal of Management, 20(2), 403–437.
6. Kraiger, K. and Wenzel, L. H. (1997). Conceptual development and empirical evaluation of measures of shared mental models as indicators of team effectiveness. In Brannick, M. T., Salas, E., and Prince, E. (Eds.), Team Performance Assessment and Measurement. Mahwah, NJ: Lawrence Earlbaum Associates.
7. Marks, M.A., Sabella, M.J., Burke, C.S., & Zaccaro, S.J. (2002). The impact of crosstraining on team effectiveness. Journal of Applied Psychology, 87(1), 3–13.
8. J. E. Mathieu, T. S. Heffner, G. F. Goodwin, E. Salas, and J. A. CannonBowers, “The influence of shared mental models on team process and performance,” Journal of Applied Psychology, vol. 85, no. 2, pp. 273–283, 2000.
9. Mohammed, S., & Dumville, B. C. (2001). Team mental models in a team knowledge framework: Expanding theory and measurement across disciplinary boundaries. Journal of Organizational Behavior Special Issue: Shared Cognition, 22(2), 89–106.
10. S. Mohammed, L. Ferzandi, and K. Hamilton, “Metaphor no more: A 15-year review of the team mental model construct,” Journal of Management, vol. 36, no. 4, pp. 876–910, 2010.
11. Park, O., & Gittleman, S.S. (1995). Dynamic characteristics of mental models and dynamic visual displays. Instructional Science, 23, 303–320.
12. S. Qureshi, M. Liu, and D. Vogel, “The effects of electronic collaboration in distributed project management,” Group Decision and Negotiation, vol. 15, no. 1, pp. 55–75, 2006.
13. A. Rafaeli, S. Ravid, and A. Cheshin, “Sensemaking in virtual teams: The impact of emotions and support tools on team mental models and team performance,” International Review of Industrial and Organizational Psychology, vol. 24, pp. 151–182, 2009.
14. R. Rico, M. Sanchez-Manzanares, F. Gil, and C. Gibson, “Team implicit coordination processes: A team knowledge-based approach,” Academy of Management Review, vol. 33, no. 1, pp. 163–184, 2008.
15. Rouse, W.B., & Morris, N.M. (1986). On looking into the black-box - prospects and limits in the search for mental models. Psychological Bulletin, 100(3), 349–363.
16. R. J. Stout, J. A. Cannon-Bowers, and E. Salas, “The role of shared mental models in developing team situational awareness: Implications for training,” Training Research Journal, vol. 2, pp. 85–116, 1996.
17. R. J. Stout, J. A. Cannon-Bowers, E. Salas, and D. M. Milanovich, “Planning, shared mental models, and coordinated performance: An empirical link is established,” Human Factors, vol. 41, pp. 61–71, 1999.
18. K. E. Weick and K. H. Roberts, “Collective mind in organizations: Heedful interrelating on flight decks,” Administrative Science Quarterly, vol. 38, no. 3, pp. 357–381, 1993.